CRM Pipeline Design: How to Build a Sales Flow That Actually Converts
Learn how to design a CRM pipeline that mirrors your real sales process, reduces lost deals, and significantly increases conversion rates.

Rasmus Rowbotham
Founder of Foundbase and experienced entrepreneur with over 10 years of experience in building and scaling businesses.
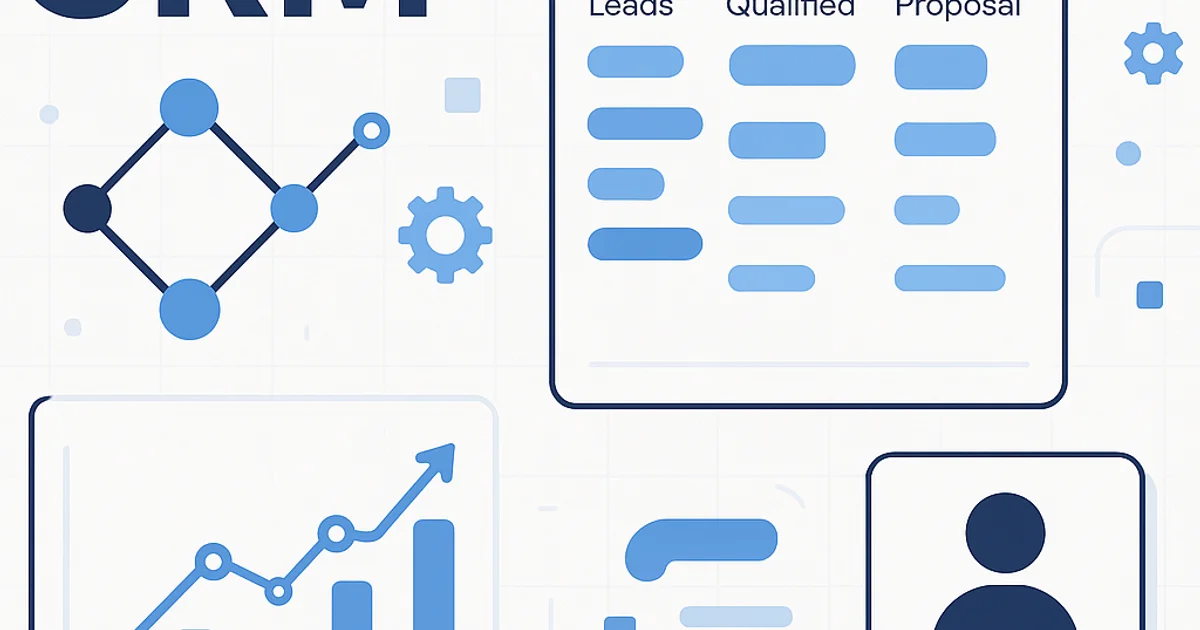
What is a CRM Pipeline?
A CRM pipeline visualizes your entire sales process—from first contact to closed deal. Its power lies in structure, timing, and data quality. When implemented correctly, it can increase conversion rates by 20–40% according to HubSpot.
5 Key Facts
- Top-performing B2B teams typically have 6–8 pipeline stages.
- Over 60% of lost deals stem from undefined next steps in CRM.
- Biweekly pipeline reviews reduce deal stagnation by up to 35%.
- Automated stage-based actions improve follow-up efficiency by 42%.
- Lead-to-deal conversion rate should range between 12–25% in structured teams.
When to Use vs. Avoid a Pipeline
| Use When | Avoid When |
|---|---|
| You have repeatable sales processes with fixed steps | You handle one-off projects without follow-up |
| Multiple people are involved in the sales cycle | Sales is purely inbound or unstructured |
| You track probabilities and forecasts | You do not measure phase-based performance |
Comparison: Pipeline vs Kanban vs Forecast
| Feature | Pipeline | Kanban | Forecast |
|---|---|---|---|
| Visualization | Linear stages | Card-based | Numerical output |
| Data focus | Deal progression | Status and tasks | Revenue estimation |
| Best for | Sales management | Team coordination | Executive reporting |
See the related CRM Automation Framework for linking stages to automated workflows.
Step-by-Step: Building a High-Converting Pipeline
- Map your current sales process. List all stages from first contact to closing. Use data from the past six months.
- Define exit criteria for each stage. Example: 'Meeting booked' means the client confirmed the date.
- Assign ownership and automation. Who owns each stage? What automated actions should trigger?
- Use colors and probabilities. For instance, 20% for 'Qualified Lead', 80% for 'Negotiation'.
- Test and iterate. After 4 weeks, adjust based on lost deals and conversion rate per stage.
Before and After Example
| Before | After |
|---|---|
| All leads marked as 'Open' | Leads categorized into 6 defined stages |
| No automated follow-ups | Automatic email after 3 days of inactivity |
| Unclear deal statuses | Clear next steps in every stage |
Learn more about maintaining accuracy in CRM Data Quality.
Three Common Trade-offs
- Complexity vs. clarity: More stages bring insight but may reduce focus.
- Automation vs. flexibility: Heavy automation limits manual maneuvering.
- Structure vs. speed: Tight pipelines demand discipline but improve forecast accuracy.
Pipeline Frameworks to Consider
| Framework | Focus | Best For |
|---|---|---|
| BANT (Budget, Authority, Need, Timing) | Qualification | Complex B2B sales |
| MEDDIC | Enterprise deals | Multi-decision sales cycles |
| CHAMP | Need-driven | Startups with rapid cycles |
Check out the Behavioral Lead Scoring guide to automate lead qualification within your pipeline.
90-Day Implementation Plan
- Weeks 1–2: Map your flow and define stage criteria.
- Weeks 3–4: Create pipeline in CRM and link automations.
- Month 2: Test with 10–20 active deals and adjust thresholds.
- Month 3: Measure conversion rates and refine structure.
Start building your own at Foundbase Free CRM in under 30 minutes.
Frequently asked questions
Q: How many stages should an effective CRM pipeline have?
Most effective CRM pipelines include 6–8 stages, depending on the complexity of your sales process. Simpler setups might work with 5, while enterprise teams may need up to 10.
Q: How can you tell if a pipeline is performing well?
Track stage-by-stage conversion rates and average time per stage. If deals stagnate for over two weeks without movement, review your stage definitions and automation triggers.
Q: What is the difference between pipeline and forecast in CRM?
A pipeline visualizes deal progress, while a forecast estimates expected revenue based on probabilities assigned to each stage. The forecast depends on the accuracy of pipeline data.
Related guides
crm for lead conversion optimization: boost sales
Discover how to optimize your CRM to improve lead conversions. Gain insights into strategies and practical tips to boost your sales.
Rasmus Rowbotham
crm for startup customer success: Boost growth
Discover how crm for startup customer success can enhance your business growth. Implement effective strategies and tools for small teams.
Rasmus Rowbotham
crm customization for startups: Boost efficiency
Learn how to customize your CRM for your startup and enhance efficiency. Get tailored solutions and optimize your business.
Rasmus Rowbotham